Kooiti Masuda (1), Panduka Neluwala (2), Kinya Toride (4,3), Kei Yoshimura (3), Hidenori Tanaka (5), Sho Miyazaki (5), Satoshi Nozawa (5), Mika Ichino (6), Yu Okubo (7,8), Junpei Hirano(7)
増田 耕一、Panduka Neluwala、取出 欣也、芳村 圭、田中 秀憲、宮崎 将、野澤 恵、市野 美夏、大久保 優、平野 淳平
Supplementary information is [here]
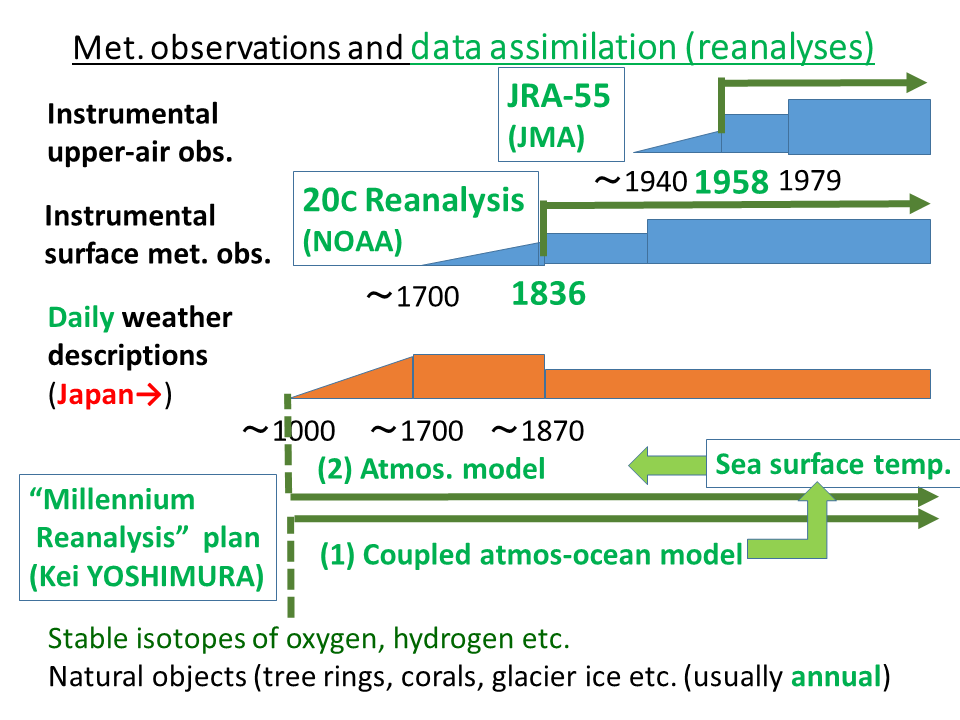
As for sources of information about weather and climate before the time when instrumental observations became available, documents written by people is one of the important group, besides natural objects such as tree rings. In particular, Japan has many diaries which contain description of daily weather, from which we can obtain information about climate with high time resolution.

The technique of data assimilation has been developed. It consists of a combination of a numerical model based on basic laws of physics and schemes of statistical estimation. It is used, not only for real-time weather forecasts, but also for production of consistent data sets for climate research, called "reanalysis". Kei Yoshimura has a vision called "millennial reanalysis", i.e. reanalysis for a 1000-year time frame. First, an atmosphere-ocean coupled climate model is used, into which information which has annual time resolution, such as isotopes of annual tree rings, are assimilated. Second, an atmospheric model is used with information of sea surface temperature from the first step, into which information which has daily time resolution, such as daily weather description, are assimilated. This presentation is a report of an evaluation of the technique for its second step, with data of the time period for which instrumental observations are available.
As for the atmospheric model, we use a version of NCEP (National Centers for Environmental Prediction, USA)'s GSM (Global Spectral Model) which had been used for seasonal predictions until 2004. Its horizontal resolution is "T62", which corresponds to grid intervals approx. 200 km. As for the assimilation scheme, we use LETKF (local ensemble transform Kalman filter) following the implementation of Miyoshi (2011). The number of members in the LETKF ensemble is 30. As for the sea surface temperature which is used as the boundary condition, we use monthly values of NOAA OISST, with interpolation in time into daily resolution. The target time period of the experiment is the year 1995, from 1 January to 31 December.
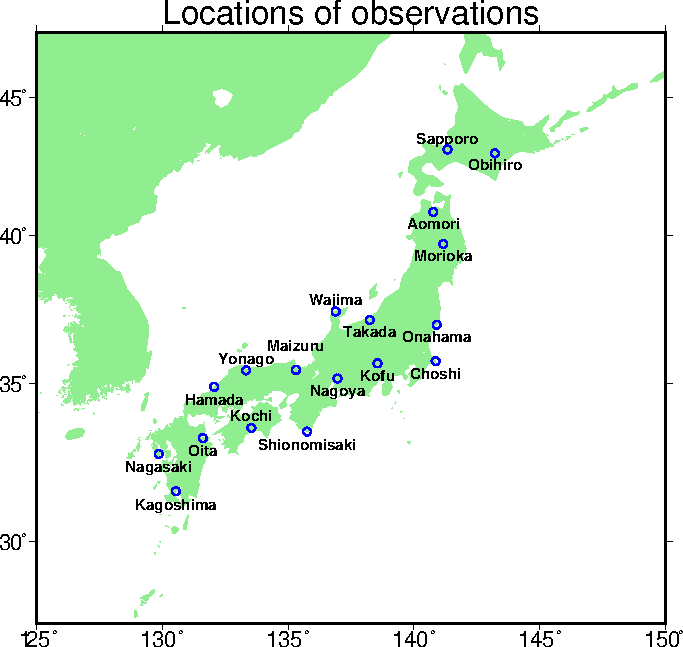
As for the source of input which mimic weather descriptions in diaries, we use "tenki gaikyô" (general weather conditions) reported by observatories of the Japan Meteorological Agency. We chose 18 locations among them, in order to have one input location per one grid box of T62 GSM.

We classify the daytime tenki gaikyô of each station of each day into 3 categories (clear, cloudy, rainy/snowy). From it, we estimate daily downward solar radiation flux at the surface according to the method of Ichino et al. (2001, 2008). Then, we distribute it to 6-hour time intervals and feed as "observations" to the assimilation system. In addition, we give the value zero as "observation of precipitation" if and only if the tenki gaikyô does not indicate any precipitation. In this presentation, this attempt is labelled "weather assimilation experiment (W.A.Ex.)". For comparison, we also did an assimilation without observational input. It is labelled "no-observation experiment (N.O.Ex.)".

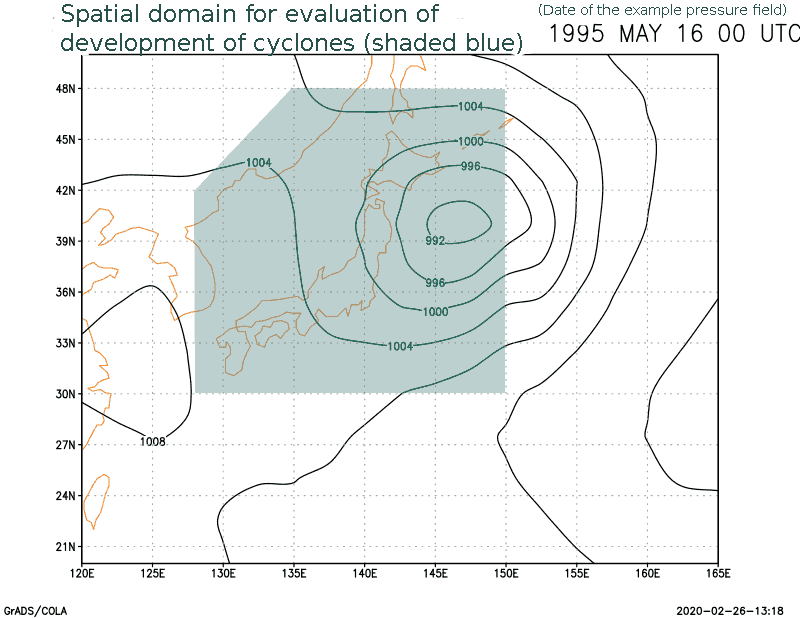
We look at the geographical distribution of sea level pressure. As for surface weather charts, we use daily weather maps printed in "Kishô Nenkan (Weather Almanac) " edited and published by Japan Weather Association. These are a simplified version of Japan Meteorological Agency's surface weather charts of 00 UTC (09 Japan Standard Time) every day. We take sea level pressure at 00 UTC every day from the results of W.A.Ex. and N.O.Ex. in 2.5 degree latitude/longitude grid, and draw contours at 4 hPa interval. We also take the same quantity from the JRA-55 Reanalysis (Kobayashi et al., 2015) in 1.25 degree latitude/longitude grid, and draw contours similarly. We judge (subjectively) whether a cyclone developed or not around the four major islands of Japan (i.e. in the region painted blue in the map), in the results of our assimilation experiments as well as in JRA-55. We also judge (subjectively) types of the synoptic meteorological field based on daily weather charts.
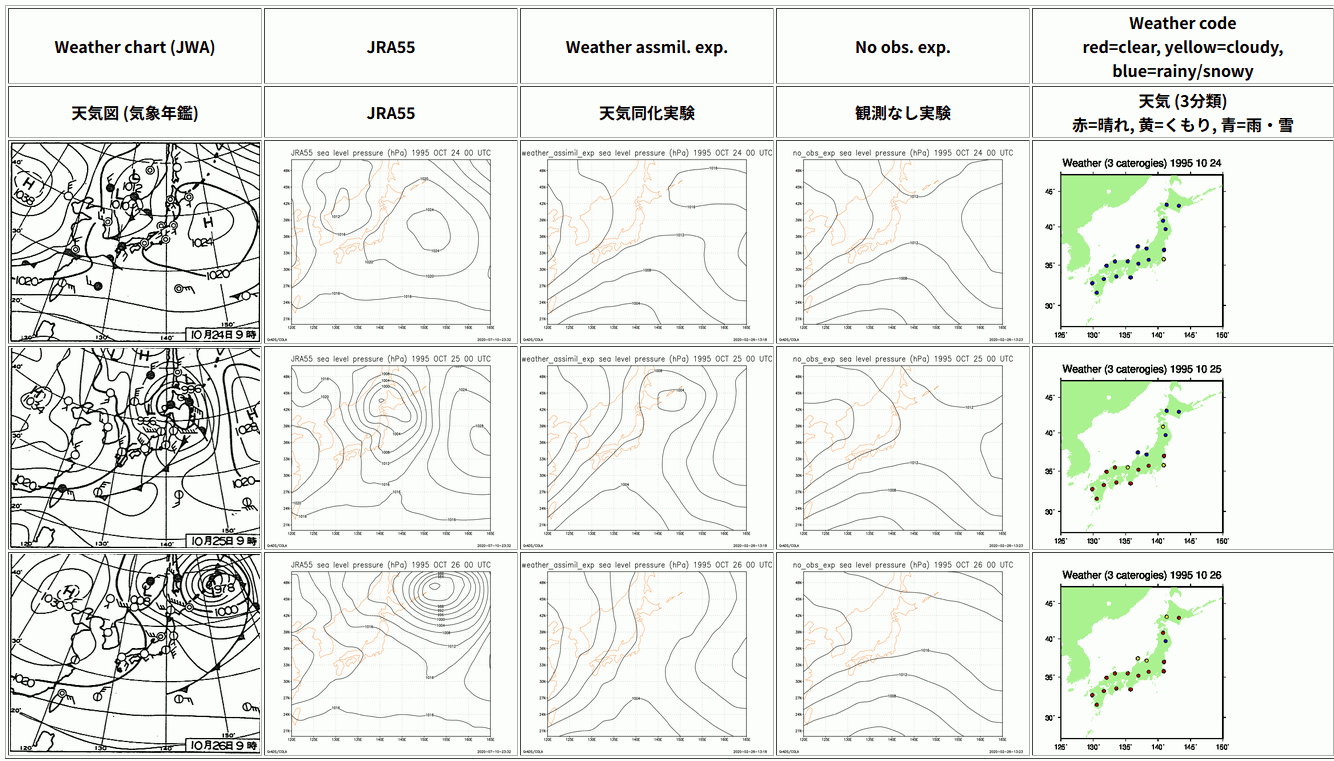
As an example of results, the fields on 24 - 26 October 1995 are shown.

On Day 24, an extratropical cyclone exists in the western part of the Sea of Japan actually. The output of W.A.Ex. does not indicate something like that, however. It resembles that of the no-observation experiment, whose pressure field has a saddle point to the east of Japan. On Day 25, the extratropical cyclone is located over the Hokkaido island, and the W.A.Ex. reproduces it, though it is shifted to the east by approx. 500 km. The observed weather was rainy on Day 24 at most of stations in Japan, and it is likely that this set of input was effective in reproducing a cyclone in this case. On Day 26, the extratropical cyclone was more developed and moved to the east actually, but it was attenuated in the W.A.Ex. It seems that the cyclone which appeared on Day 25 in the experiment did not have such a structure that spontanously develop further in the prediction model.
The counts of occurrence of cyclones by types of the synoptic meteorological field is as follows.
| Types of synoptic field → | Moving Anticyclone | Extratrop. Cyclone | Stagnant Front | Extension of Continental High from West | Extension of Subtropical High from South | Tropical Storm | Asian High, Pacific Low | Not (yet) determined | Total |
|---|---|---|---|---|---|---|---|---|---|
| JRA-55: Count when cyclone(s) exist | 13 | 98 | 22 | 2 | 2 | 2 | 36 | 29 | 204 |
| W.A.Ex.: Count when cyclone(s) exist | 13 | 37 | 11 | 2 | 1 | 0 | 30 | 17 | 111 |
| Count when cyclone(s) exist both in JRA-55 and W.A.Ex. | 8 | 34 | 6 | 1 | 0 | 0 | 19 | 14 | 82 |
| JRA-55: Percentage of occurrence of cyclone(s) in each type of synoptic field | 18.3 | 89.9 | 47.8 | 22.2 | 18.2 | 50.0 | 59.0 | 53.7 | 55.9 |
| W.A.Ex.: Percentage of occurrence of cyclone(s) in each type of synoptic field | 18.3 | 33.9 | 23.9 | 22.2 | 9.1 | 0.0 | 49.2 | 31.5 | 30.4 |
| Percentage of occurrence of cyclone(s) in W.A.Ex / occurrence of cyclone(s) in JRA-55 | 61.5 | 34.7 | 27.3 | 50.0 | 0.0 | 0.0 | 52.8 | 48.3 | 40.2 |
When the synoptic field is extratropical-cyclone type, the fraction of the cases where W.A.Ex. reproduced cyclone(s) to the cases where cyclone(s) were observed in JRA-55 is approx. 1/3. Furthermore, even when this type of evaluation suggests success, the geographical position of the reproduced cyclone may differ from the actual one. In particular, in October and November, the pressure pattern of the output of the assimilation system is likely to have a saddle point to the east of Japan and troughs both to the south and to the northeast. Then, even when cyclones exist over the Sea of Japan or over the Japanese islands, the result of assimilation is likely show deepening of either one of the troughs.
When the synoptic field is stagnant-front type, reproduction of cyclone(s) is difficult, as we anticipated. During the Baiu season (June to July), W.A.Ex. roughly reprocuded a zonal pressure trough around where the Baiu front actually exists. Its companion zonal pressure ridge may appear to the south of the trough (correctly) or to the north of it (incorrectly). The actual situation during the early part of August 1995 had a stagnant front (similar to Baiu front) around Hokkaido. W.A.Ex. did not reproduce it, but showed a zonal pressure ridge at that location (incorrectly).
We can conditionally reproduce occurrence of extratropical cyclones (i.e. meteorological disturbances with a horizontal scale larger than 1000 km) by incorporating weather information as the amount of solar radiation and a flag of precipitation into a data assimilation system whose grid interval is approx. 200 km. We have not determined the specific condition yet. We can speculate, however, that the following factors are important: